
Calorie and nutrient intake over time
For many years, I’ve noticed that physical activity is a great way to maintain or lose weight because being active adds to your life. It’s a positive thing. Many people instantly tell me they don’t like being active, but I quickly and consistently find things they like doing that are active that they didn’t realise could count. For example, just popping out for a walk is important if you do no activity at all.
When you want to get control over your weight, I want to explain why activity is, in my opinion, a better thing to focus on than the calories you eat.
Take a look at the graph below. What it shows is the average calorie intake in the UK between 1940 (yes, during wartime rationing) and 2000.
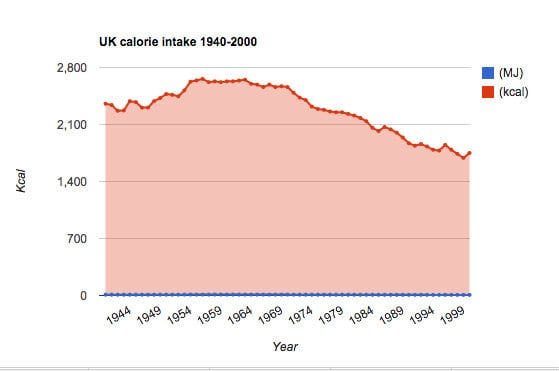
What you see is that we actually ate over 400 calories more during World War II, when obesity was extremely rare, compared to the year 2000, when obesity was a huge concern.
Given that the data is from the goverment department Defra I feel this is pretty compelling evidence that the idea of losing weight and preventing obesity by eating less just doesn’t add up. Either that or there are some serious flaws in how the government collects and presents information.
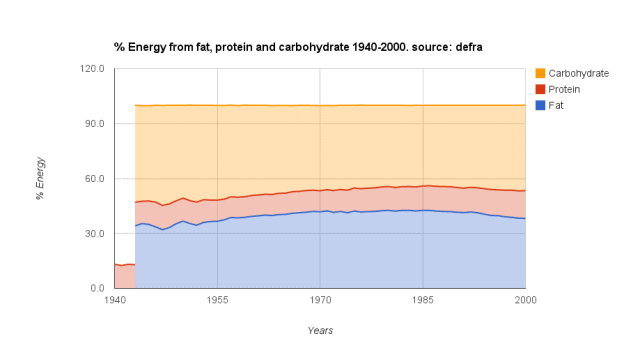
We’re also told that more of our calories should come from carbohydrate and less from fat. The chart below shows that we used to achieve this much better than we do now.
So if we’re eating so much less, how come we’re so much bigger than we used to be? What’s changed? We all know what’s changed, but we take it for granted. We’re just so much less active than we ever used to be.
Years ago, we used to walk or cycle to work or the shops. We’d walk up stairs. Many of our jobs involved physical labour. So we spent a lot of calories just getting through our days that we don’t spend any more. The key is that our bodies are designed for an active lifestyle, not a sedentary one. I haven’t been able to track down the statistics on activity over time, mainly because no one thought to record them. Most people don’t think of measuring activity because they believe that we are what we eat instead of what we do, but when I find the stats, I’ll post them here.
Importantly, it’s also logical that if we eat less food, we’re probably consuming fewer nutrients than we used to. The data from Defra indicates this isn’t the case for most nutrients, which is encouraging.
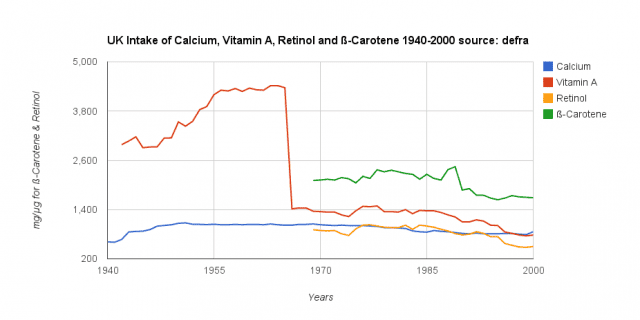
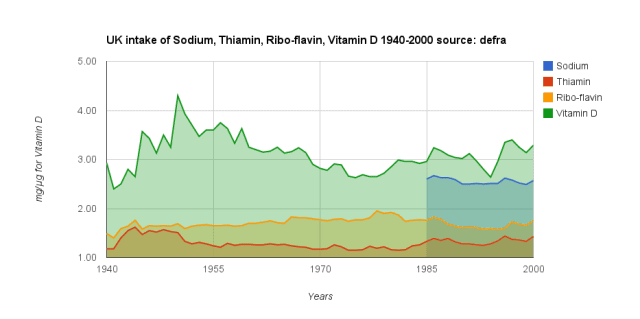
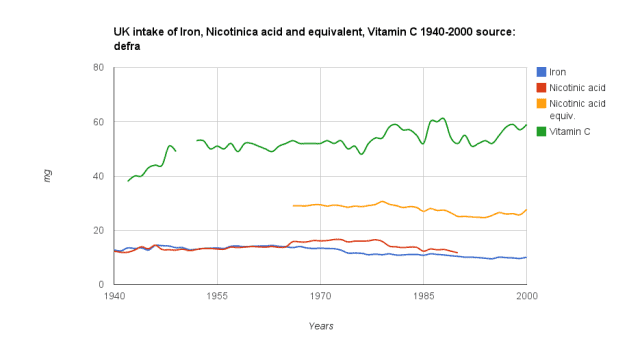
I showed the data in multiple graphs because the amount required of each nutrient varies wildly. So, I grouped the nutrients into similar values. One or two of the nutrients, mainly the vitamin A equivalents and Retinol, seem to have declined over time, but the values of the others have remained relatively stable or increased.
The point is that while our overall calories may have been reduced, our micronutrients appear to have stayed the same. Why is a big debate, but the idea that we all need supplements is not supported.
Resources
The data came from the Nutshist spreadsheet on the Defra website. I created the graphs by uploading the data as a google spreadsheet
This post first appeared on my original blog colchambers
Learn more
If you found this article helpful, then you need to check out the course it comes from. It’s full of tips and advice that you can use right now.

How To Lose Weight
Further references
Finding correct, reliable and relevant data has been the hardest part of the challenge. Some of the related data is below though comparisons are hard due to the varying nature of the data.
- Divergent trends in obesity and fat intake patterns: The American paradox
- Nutrient intake through time and across regions
- Diet and Health: Implications for Reducing Chronic Disease Risk by National Research Council (US) Committee on Diet and Health.
- National diet and nutritional survey (UK) NDNS: results from years 9 to 11 (2016 to 2017 and 2018 to 2019)
- A Government Statistical Service perspective on official estimates of calorie consumption The Behavioural Insight Team’s ‘Counting Calories’ report explains the apparent decrease in calorie intake over time by presenting evidence that calorie consumption is underestimated and also suggests that the degree of underestimation has increased over time. This article provides a GSS response to that report.
- Average daily energy intake from food and drink in the United Kingdom (UK) from 2001/02 to 2015


